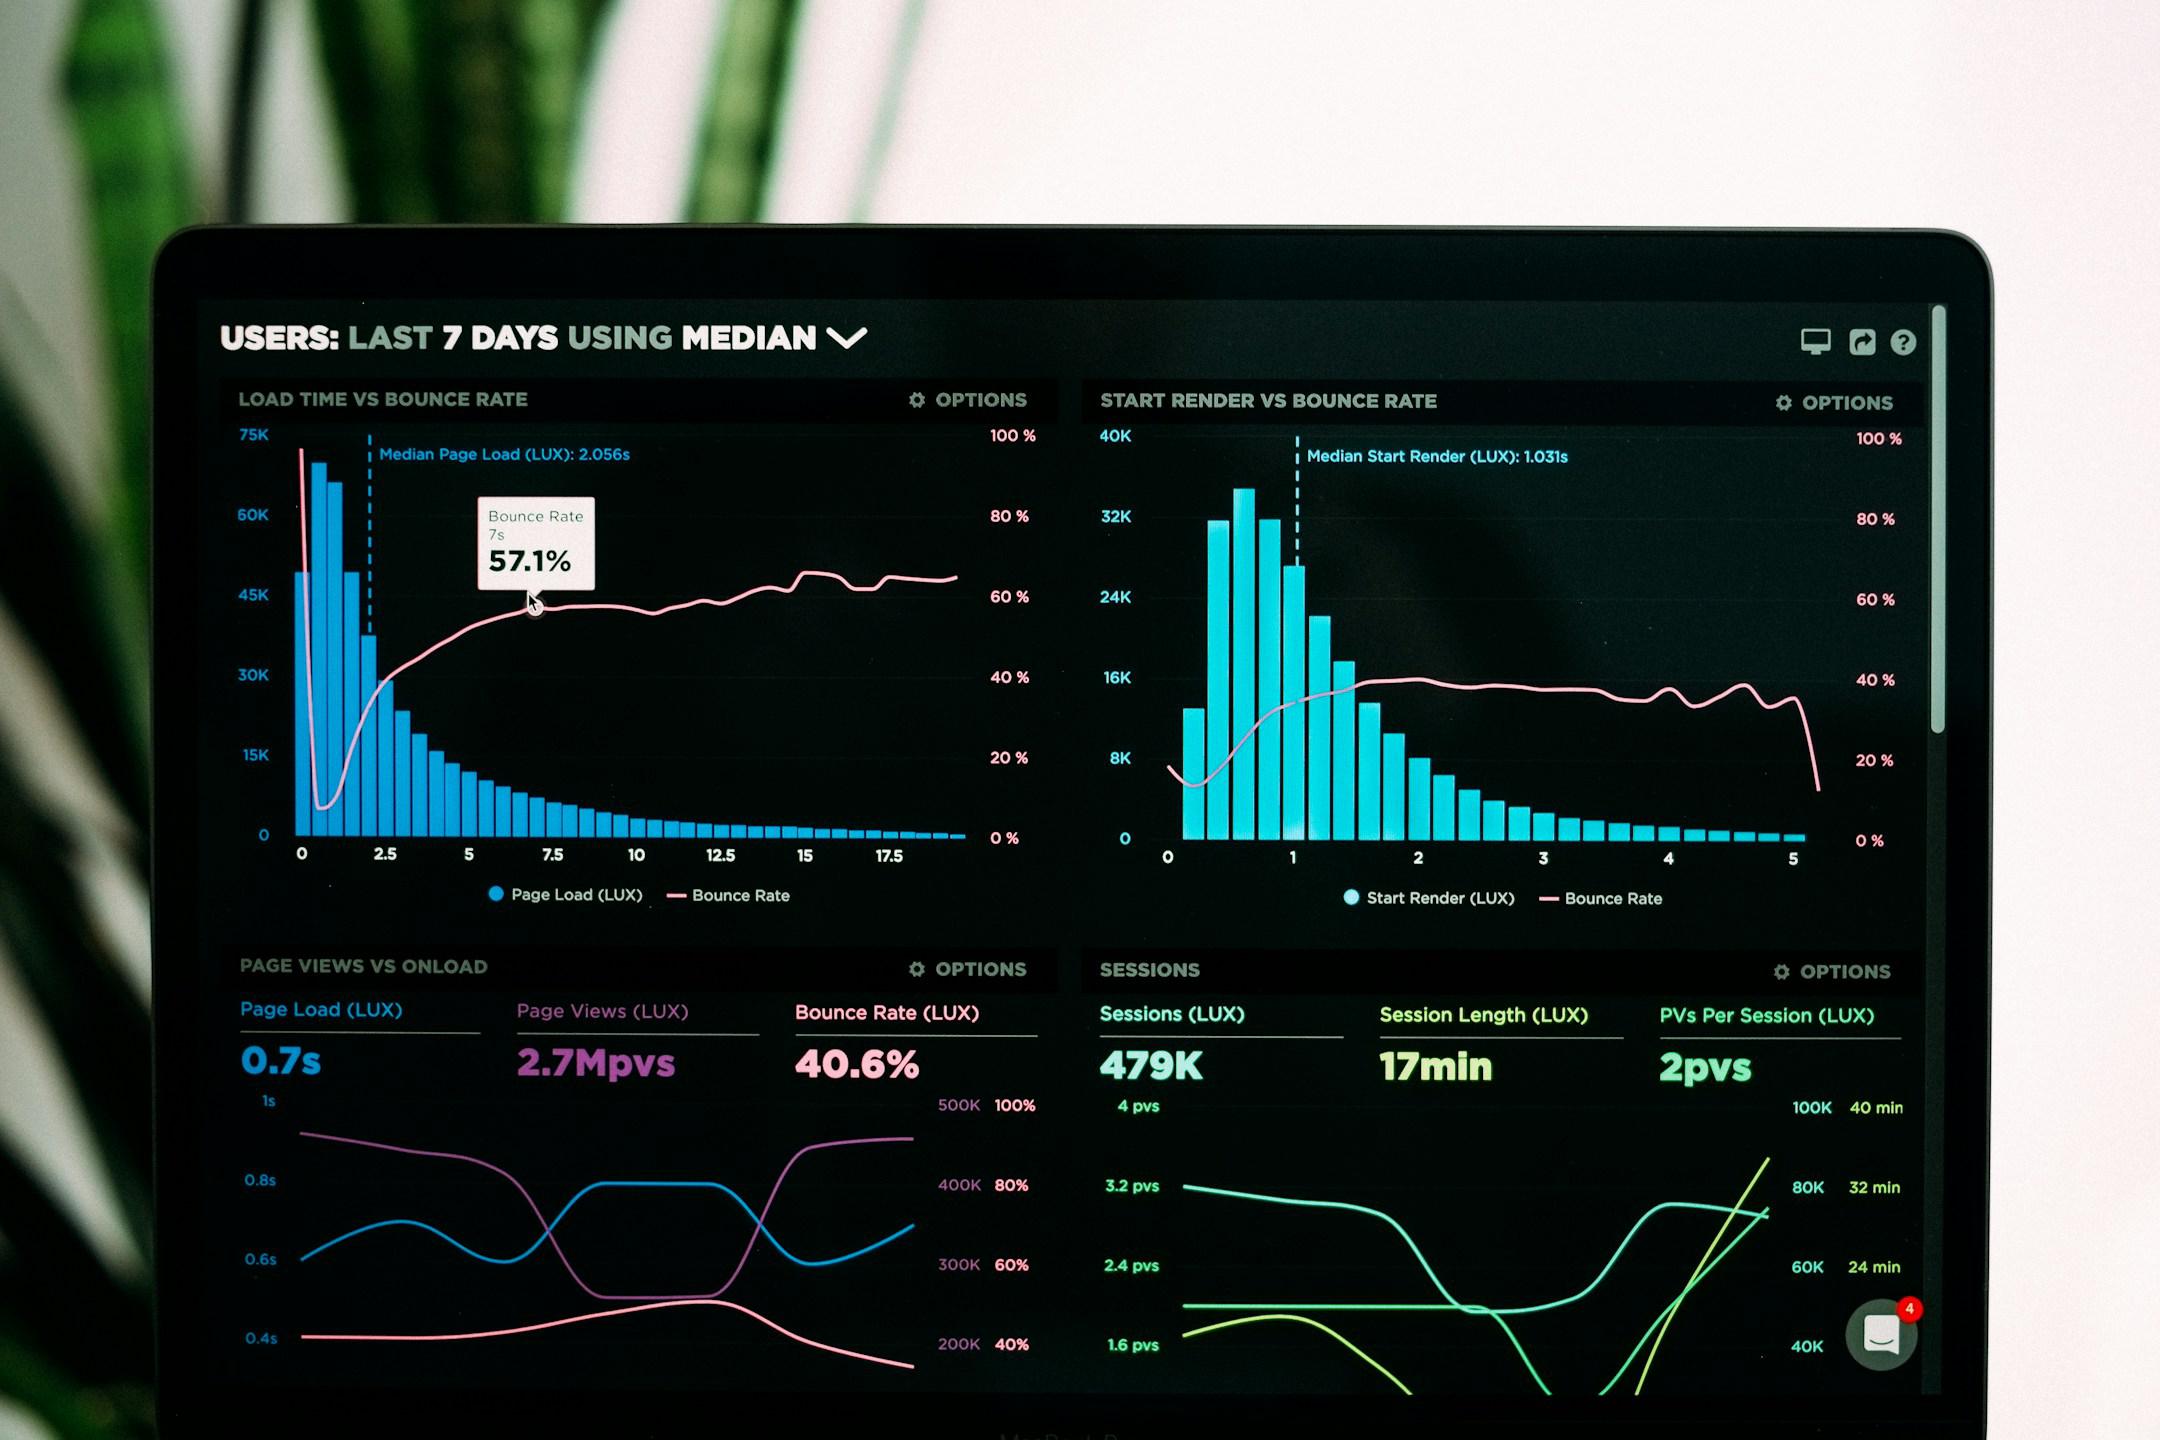
Compelling visualizations
Transform data into engaging visual representations.
Compelling visualizations
Transform your research findings into visually compelling representations that enhance the understanding and impact of your work. Our skilled data visualization experts create stunning graphs, charts, and interactive dashboards that effectively communicate complex information in a visually appealing manner, making your research more accessible and engaging.

Let's talk
We would love to hear from you!